Hello,
I'm running a server for a while, and during summer, I've upgraded its system from FreeBSD 9.3-RELEASE to FreeBSD 10.1-RELEASE.
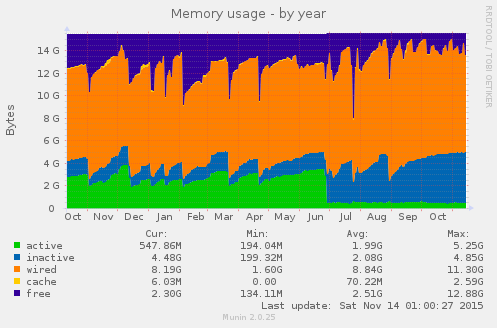
My sysutils/munin-node monitoring shows a change in memory allocation on this server: there is clearly a before and an after

Any pointer that could explain the huge difference between active memory measurements in 9.x and 10.x ?
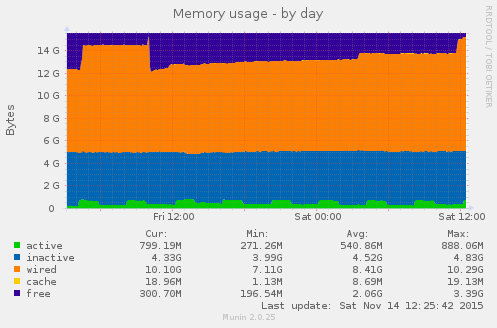
And when I look at a daily report, I can see the active memory going up for about 2 hours, then going down for about 2 hours, then going up again:

Is there any way I can find out what processes are responsible for this behavior? (I mean something more straightforward than taking a ps(1) or top(1) sample every 5 minutes during 5 hours...)
edit: finally I've used a scheduled top(1) in batch mode to retrieve stats for every processes. Turn's out www/apache24 is responsible for the ups and downs of active memory. Main question remains…
I'm running a server for a while, and during summer, I've upgraded its system from FreeBSD 9.3-RELEASE to FreeBSD 10.1-RELEASE.
My sysutils/munin-node monitoring shows a change in memory allocation on this server: there is clearly a before and an after
freebsd-update (end of June):
Any pointer that could explain the huge difference between active memory measurements in 9.x and 10.x ?
And when I look at a daily report, I can see the active memory going up for about 2 hours, then going down for about 2 hours, then going up again:

Is there any way I can find out what processes are responsible for this behavior? (I mean something more straightforward than taking a ps(1) or top(1) sample every 5 minutes during 5 hours...)
edit: finally I've used a scheduled top(1) in batch mode to retrieve stats for every processes. Turn's out www/apache24 is responsible for the ups and downs of active memory. Main question remains…
Last edited:
