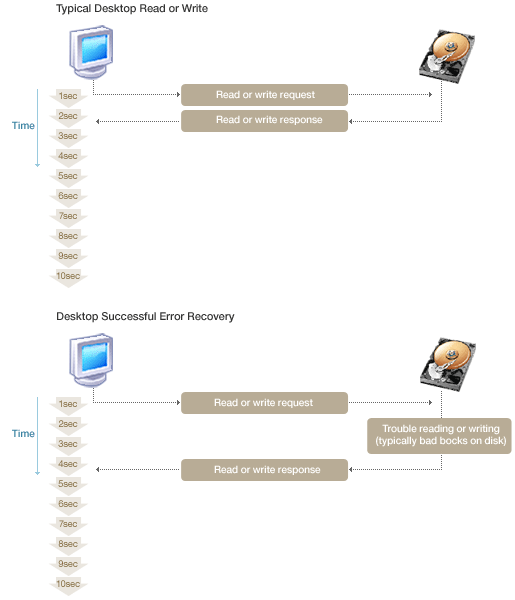
Here's why it's important to use HDD with Time Limited Error Recovery (TLER) / Error Recovery Control (ERC) in RAID volumes. When the disk have problem with reading some sector it stop responding to the controller and if the raid controller didn't hear the disk for specific time the entire disk is ejected from the raid. The server disks have TLER set to < 7sec which limit the time that the disk spend of trying to read/write to the sector before reporting an error back to the controller and reallocate that sector.
I have a normal standard desktop disk without ERC which recently get ejected from Raid volume due to problems with some sectors.
The SMART status of the disk show some pending sectors:

When i run the SHORT smart test it also fail with the following error:
To force those pending sector to be reallocated i needed to write some data to them and without knowing exact LBA i decide to fill the entire disk using dd (destroy all data):
After that i run again SMART Long test which this time completed w/o error
Then I check again the SMART status to see if those sectors are reallocated or fixed:
After that i run some benchmark test using bonnie++ with gnuplot and spot unusual drop of the read/write speed at one zone around 1.6TB offset.
Performing read/write test (destroy all data on the disk) on each 2th 512MB block (skip=2) and saving result into csv file
Generating the chart from both csv files using gnuplot-lite into svg file

For comparison here's another 500GB disk:

After some research i found that this is due to sector slipping which is very well explained here:
 blog.stuffedcow.net
Here's a good example for the TLER/ERC.

 www.smallnetbuilder.com
Some desktop (non-server) disks also support TLER which can be turned on using smartctl or wdtler / seatools.
I have a normal standard desktop disk without ERC which recently get ejected from Raid volume due to problems with some sectors.
The SMART status of the disk show some pending sectors:
When i run the SHORT smart test it also fail with the following error:
Code:
Num  Test_Description    Status                  Remaining  LifeTime(hours)  LBA_of_first_error
# 1  Extended offline    Completed: read failure       90%       565         3240083936
# 2  Extended offline    Completed: read failure       90%       432         3240083936
# 3  Short offline       Completed: read failure       90%       432         3240083936
# 4  Short offline       Completed: read failure       90%       432         3240083936
# 5  Conveyance offline  Completed: read failure       90%       432         3240083936
# 6  Conveyance offline  Completed: read failure       90%       432         3240083936
To force those pending sector to be reallocated i needed to write some data to them and without knowing exact LBA i decide to fill the entire disk using dd (destroy all data):
dd if=/dev/zero of=/dev/ada0 bs=1MAfter that i run again SMART Long test which this time completed w/o error
smartctl -t long /dev/ada0
Code:
smartctl -l selftest /dev/ada0

smartctl 7.4 2023-08-01 r5530 [FreeBSD 14.1-RELEASE amd64] (local build)
Copyright (C) 2002-23, Bruce Allen, Christian Franke, www.smartmontools.org

=== START OF READ SMART DATA SECTION ===
SMART Self-test log structure revision number 1
Num  Test_Description    Status                  Remaining  LifeTime(hours)  LBA_of_first_error
# 1  Extended offline    Completed without error       00%       587         -
# 2  Extended offline    Completed: read failure       90%       565         3240083936
# 3  Extended offline    Completed: read failure       90%       432         3240083936
# 4  Short offline       Completed: read failure       90%       432         3240083936
# 5  Short offline       Completed: read failure       90%       432         3240083936
# 6  Conveyance offline  Completed: read failure       90%       432         3240083936
# 7  Conveyance offline  Completed: read failure       90%       432         3240083936
6 of 6 failed self-tests are outdated by newer successful extended offline self-test # 1
Then I check again the SMART status to see if those sectors are reallocated or fixed:
smartctl -a /dev/ada0
Code:
SMART Attributes Data Structure revision number: 10
Vendor Specific SMART Attributes with Thresholds:
ID# ATTRIBUTE_NAME          FLAG     VALUE WORST THRESH TYPE      UPDATED  WHEN_FAILED RAW_VALUE
  1 Raw_Read_Error_Rate     0x000f   117   099   006    Pre-fail  Always       -       127067600
  3 Spin_Up_Time            0x0003   096   096   000    Pre-fail  Always       -       0
  4 Start_Stop_Count        0x0032   100   100   020    Old_age   Always       -       68
  5 Reallocated_Sector_Ct   0x0033   100   100   010    Pre-fail  Always       -       0
  7 Seek_Error_Rate         0x000f   089   060   030    Pre-fail  Always       -       933763960
  9 Power_On_Hours          0x0032   100   011   000    Old_age   Always       -       598
 10 Spin_Retry_Count        0x0013   100   100   097    Pre-fail  Always       -       0
 12 Power_Cycle_Count       0x0032   100   100   020    Old_age   Always       -       59
183 Runtime_Bad_Block       0x0032   100   100   000    Old_age   Always       -       0
184 End-to-End_Error        0x0032   100   100   099    Old_age   Always       -       0
187 Reported_Uncorrect      0x0032   070   070   000    Old_age   Always       -       30
188 Command_Timeout         0x0032   100   099   000    Old_age   Always       -       2 2 2
189 High_Fly_Writes         0x003a   067   067   000    Old_age   Always       -       33
190 Airflow_Temperature_Cel 0x0022   077   058   045    Old_age   Always       -       23 (Min/Max 22/23)
191 G-Sense_Error_Rate      0x0032   100   100   000    Old_age   Always       -       0
192 Power-Off_Retract_Count 0x0032   100   100   000    Old_age   Always       -       21
193 Load_Cycle_Count        0x0032   100   100   000    Old_age   Always       -       966
194 Temperature_Celsius     0x0022   023   042   000    Old_age   Always       -       23 (0 13 0 0 0)
197 Current_Pending_Sector  0x0012   100   100   000    Old_age   Always       -       0
198 Offline_Uncorrectable   0x0010   100   100   000    Old_age   Offline      -       0
199 UDMA_CRC_Error_Count    0x003e   200   200   000    Old_age   Always       -       0
240 Head_Flying_Hours       0x0000   100   253   000    Old_age   Offline      -       78728h+02m+03.167s
241 Total_LBAs_Written      0x0000   100   253   000    Old_age   Offline      -       565858594670
242 Total_LBAs_Read         0x0000   100   253   000    Old_age   Offline      -       913997112022
After that i run some benchmark test using bonnie++ with gnuplot and spot unusual drop of the read/write speed at one zone around 1.6TB offset.
Performing read/write test (destroy all data on the disk) on each 2th 512MB block (skip=2) and saving result into csv file
zcav -w -s 2 -f /dev/ada0 > ST2000DM001-write-512M.csv
zcav -s 2 -f /dev/ada0 > ST2000DM001-read-512M.csv
Generating the chart from both csv files using gnuplot-lite into svg file
set title "Disk throughput"
set xlabel "Offset GB"
set ylabel "MB/s"
set grid
set terminal svg
set output "plot.svg"
set multiplot
set object 1 rect from 1050,84 to 100,155 fc rgb "white" fillstyle solid noborder
plot "ST2000DM001-write-521M.csv" w lines lt 7 title "ST2000DM001 write", \
"ST2000DM001-read-521M.csv" w lines lt 10 title "ST2000DM001 read"
set origin 0.1, 0.15
set size 0.5, 0.4
set xrange [1590:1690]
set yrange [115:135]
unset title
unset xlabel
unset ylabel
unset grid
plot "ST2000DM001-write-521M.csv" w lines lt 7 notitle , \
"ST2000DM001-read-521M.csv" w lines lt 10notitle
unset multiplot
For comparison here's another 500GB disk:
set title "Disk throughput"
set xlabel "Offset GB"
set ylabel "MB/s"
set grid
set terminal svg
set output "plot2.svg"
plot "ST500DM002-write-512M.csv" w lines lt 7 title "ST500DM002 write", \
"ST500DM002-read-512M.csv" w lines lt 10 title "ST500DM002 read"
After some research i found that this is due to sector slipping which is very well explained here:
Discovering Hard Disk Physical Geometry through Microbenchmarking « Blog
Here's a good example for the TLER/ERC.

Should You Use TLER Drives In Your RAID NAS? - SmallNetBuilder
http://forums.smallnetbuilder.com/showthread.php?p=21166
 www.smallnetbuilder.com
Some desktop (non-server) disks also support TLER which can be turned on using smartctl or wdtler / seatools.
